

Kentico provides powerful caching features, as I discussed in a previous post. In some cases, well-configured caching is all that is needed to provide a high-performance website. However, for sites that are large and under high demand, there may be a lot of cache pressure. Or if a site provides personalized content, the ability to leverage the cache may be limited. Therefore, it is often important to optimize the performance of pages as if caching is not available. One of the best ways to predict server performance is to measure SQL Server round trips.
When building Portal Engine-based sites, to measure round trips, I would simply attach SQL Server Profiler to the Kentico database, clear the cache of a page, and count the queries required to reload it. The results could often be predicted based on the use of repeaters and macro queries on the page. This is because by this time the test was run, the Kentico application would be initialized and would have fully loaded all the schema information needed to form queries.
Now, using the Kentico MVC architecture model, I’m typically measuring SQL Server round-trip performance during the execution of integration tests within Visual Studio. As a result, the performance of a query will usually be measured after minimal Kentico initialization has occurred, which can produce surprising results.
For example, here’s a simple query that returns one node:
var tree = new TreeProvider();

var result = tree.SelectNodes()

    .Types("Acme.LandingPage")

    .OnSite("Acme")

    .Culture("en-us")

    .Path("/Articles/Performance-Optimization")

    .ToList();
If I try to measure SQL Server round-trip performance by simply attaching SQL Server Profiler and then running an integration test with this query, there will be over 200 events recorded in the profiler:
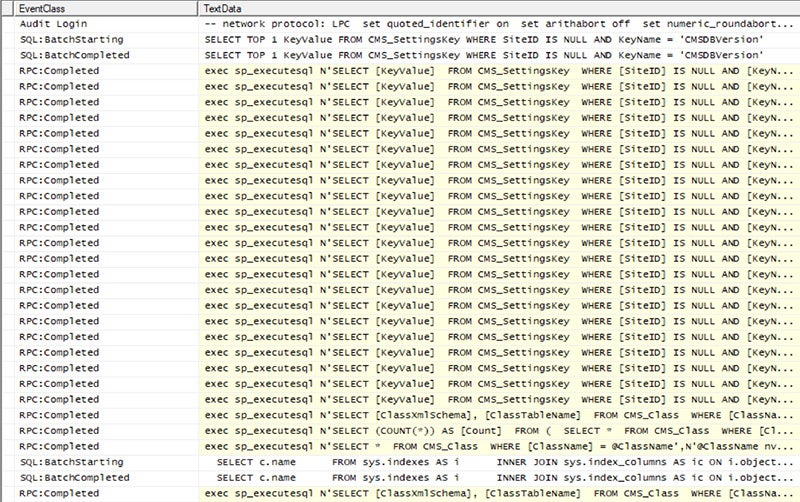
Clearly, this can’t be the responsibility of one query, so we will need to isolate the trace events that occur when it’s executed. You first might assume most of this activity is occurring during Kentico initialization. However, if the test is repeated and SQL Server Profiler’s trace window is cleared after executing CMSApplication.Init(), there are still a surprising 150 trace events:
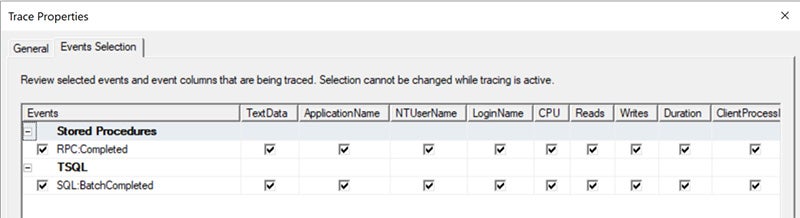
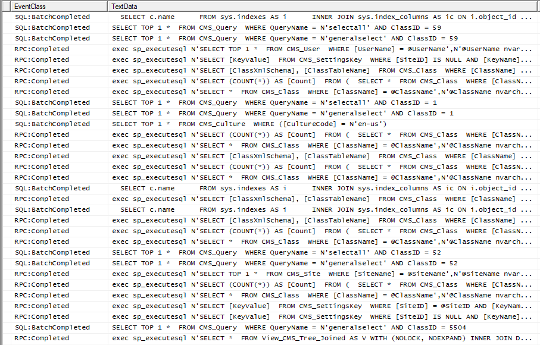
To isolate the query’s performance, the next step is to open the Trace Properties and isolate the events. I like to choose “RPC: Completed” and “SQL: Batch Completed” to allow measuring the round trips caused by the query, without selecting redundant events like “Batch Starting” and “Batch Completed.”
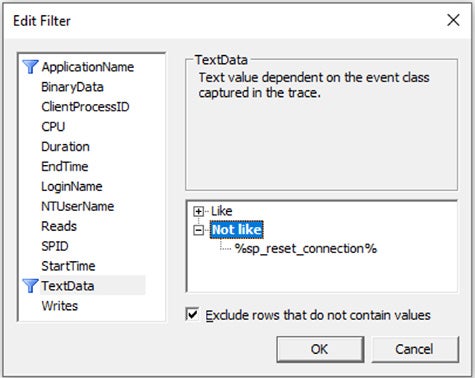
In the “Column Filters” dialog, I also like to filter out “exec sp_reset_connection”, which is called by the SQL Server Client when reusing a connection from the pool.
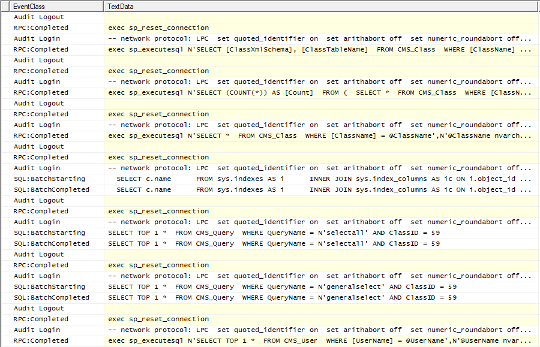
However, after reducing the event selection for the trace and repeating the previous test, there are still over 35 events for this simple query. By examining them, we can see that there are still many events that do not seem directly related to the query. For example, queries of CMS_SettingsKey and CMS_Class appear, even though the trace isn’t started until after CMSApplication.Init() is executed.
So what’s going on here? It turns out that Kentico doesn’t load all metadata during its preliminary initialization. Instead, it uses lazy loading. Kentico does not load all metadata, including basic schema and settings data, until it’s actually needed. Therefore, to isolate the impact of the query, Kentico needs to be warmed up with a query that forces it to load any metadata that might be needed by the test.
For example, to warm up Kentico for the original test query, the following query would ensure that Kentico loads metadata for all the types used by the first 1000 items in the warm-up query.
var tree = new TreeProvider();

var results = tree.SelectNodes()

                .TopN(1000)

                .OnSite("Acme")

                .AllCultures()

                .Path("/%")

                .ToList();
When repeating the test including the warm-up query, we now find that 47 trace events occur during the call to CMSApplication.Init(), over 180 events occur during the warm-up query, and only two expected SQL Server round trips occur during the actual test query (the first round trip is Kentico checking to see if there is a 'generalselect' default query for the page type).

Accurately testing SQL Server round-trip performance is an important step in optimizing a Kentico site. It highlights code that may otherwise seem innocuous but is actually causing expensive SQL Server round trips. For example, if a query is run that returns 20 nodes, but the code is using the Categories and DocumentTags properties of each node, it would easily result in over 40 SQL Server round trips.
Proactively checking round-trip performance will more than pay for itself by preventing performance problems that are costly to troubleshoot and difficult to refactor after launch. Give it a try, hopefully you will find it as useful as I do.
Have questions on how to get the most out of your Kentico implementation? Drop me a line on Twitter (@HeyMikeWills), or contact our BlueModus team of experts today.


